AWARE is to be used as a water use midpoint indicator representing the relative Available WAter REmaining per area in a watershed, after the demand of humans and aquatic ecosystems has been met. It assesses the potential of water deprivation, to either humans or ecosystems, building on the assumption that the less water remaining available per area, the more likely another user will be deprived.
It is first calculated as the water Availability Minus the Demand (AMD) of humans and aquatic ecosystems and is relative to the area (m3 m-2 month-1). In a second step, the value is normalized with the world average result (AMD = 0.0136m3m-2 month-1) and inverted, and hence represents the relative value in comparison with the average m3 consumed in the world (the world average is calculated as a consumption-weighted average). Once inverted, 1/AMD can be interpreted as a surface-time equivalent to generate unused water in this region. The indicator is limited to a range from 0.1 to 100, with a value of 1 corresponding to the world average, and a value of 10, for example, representing a region where there is 10 times less available water remaining per area than the world average. The map below shows the factors at annual level per watersheds (normal average over 12 months).
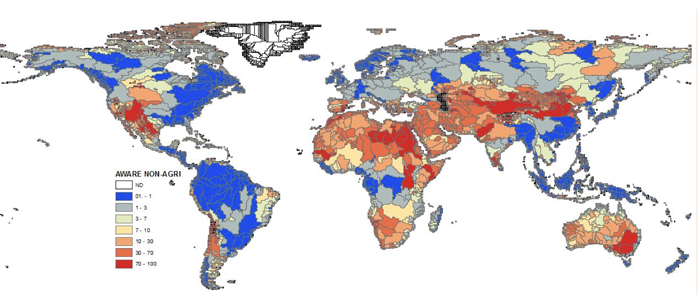
Figure 1: Map of AWARE factors for non-agricultural activities (normal average over 12 months) Interpretation – Spatio-temporal scale
The indicator is calculated at the sub-watershed level and monthly time-step, and then aggregated, if needed, to country and/or annual resolution. This aggregation can be done in different ways to better represent an agricultural use or a domestic/industrial use, based on the time and region of water use. Characterization factors for agricultural and non-agricultural use are therefore provided, as well as default (“unknown”) ones if the activity is not known.
ATTENTION! An aggregated value at country/annual level based on consumption:
• Does not represent the “average picture” of the country/year. It may completely exclude large regions where no/very low consumption occur (i.e. deserts, most of Canada, etc.).
• Is strongly influenced by agricultural water use (in both “unknown” and “agri” values).
• Represents where/when water is most consumed: often in dryer months/regions.
If the value “doesn’t look right”, look closer! (See which one to prioritize based on the variability information provided in the Excel document)
It should be noted that a factor value of 1 is not equivalent to the factor for the average water consumption in the world, i.e. the world average factor to use when the location is not known. This value is calculated as the consumption-weighted average of the factors, which are based on 1/AMD and not AMD, hence the world consumption-based average has a value of 43 for unknown use and 20 and 46 respectively for non-agricultural and agricultural water consumption respectively.
The AWARE method is recommended by :
1- the UNEP-SETAC Life Cycle Initiative
2- the PEF/OEF Program of the European Commission. See also: PEFCR guidance report
3- the International EPD system

Boulay A-M, Bare J, Benini L, et al (2018) The WULCA consensus characterization model for water scarcity footprints: assessing impacts of water consumption based on available water remaining (AWARE). Int J Life Cycle Assess 23:368–378.
Boulay A-M, Bare J, De Camillis C, Döll P, Gassert F, Gerten D, Margni M, et al. 2015. Consensus building on the development of a stress-based indicator for lca-based impact assessment of water consumption: Outcome of the expert workshops. The International Journal of Life Cycle Assessment:1-7.
Frischknecht, R., Fantke, P., Tschümperlin, L., Niero, M., Antón, A., Bare, J., … Jolliet, O. (2016). Global guidance on environmental life cycle impact assessment indicators: progress and case study. The International Journal of Life Cycle Assessment, 21(3), 429–442.
Boulay, A.-M., Pfister, S., Motoshita, M., Schenker, U., Benini, L., Gheewala, S. H., … Harding, K. (2016). Global Guidance for Life Cycle Impact Assessment Indicators, Chapter 5a: Water scarcity. UNEP SETAC Life Cycle Initiative.